
What lands in
your inbox.
Seven sections. One architecture. From the verified keyword corpus to the boardroom decision — every Urchin report is built the same way.
Seven sections.
Click any to see what’s inside.
Each section is its own deliverable. They build on each other — corpus feeds demand, demand feeds signals, signals feed the deep dive, the deep dive feeds the playbook. By section seven you are looking at the next move, not a summary.
From a Covertree run — specialty home insurance, US.
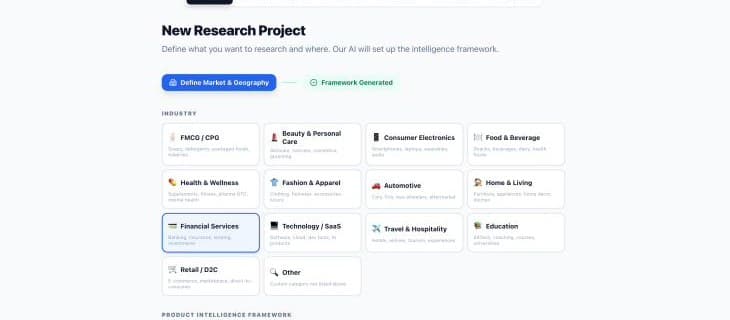
Every engagement begins with a precise scope: the category universe, the markets and languages in play, the brand set, the time window, and what counts as adjacent versus out of frame. We agree on this in writing before a single keyword is pulled. It is the most-important under-discussed step in research — the one that decides whether the rest of the report is honest or theatre.
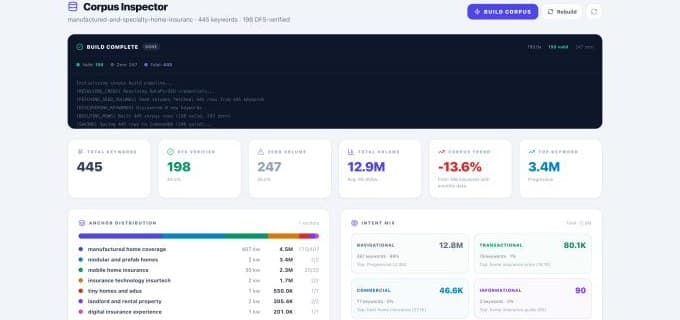
445 keywords. 198 DFS-verified. 12.9M monthly volume.
The full keyword set that defines the category — typically 400 to 2,500 terms, depending on breadth. Each one is classified by intent and weighted: 1.0× for high commercial / transactional intent, 0.7× for comparison and consideration, 0.5× for problem–solution queries. Pure educational queries, broad generic terms, and non-category-adjacent searches are deliberately excluded so the demand signal stays honest.
Need-state architecture, not topic clouds. We layer the four signal types over each other and surface the underlying need-states — functional, identity-led, ritualistic, social — that drive the category. We also surface the gap between what consumers say they want (the survey answer) and what they reveal they want (the search query, the review, the unfiltered forum question). That gap is where most strategy goes wrong.
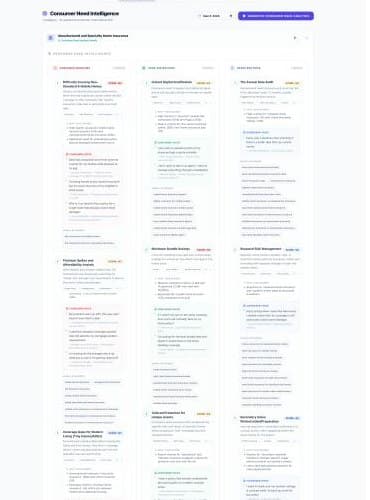
Need-state architecture, with consumer language.
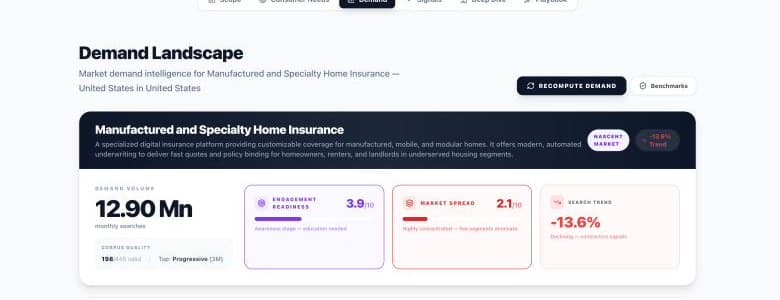
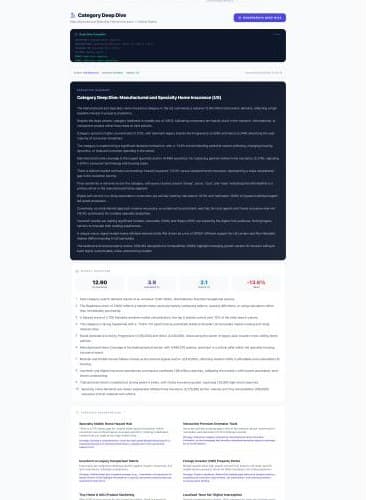
12.9M searches. Readiness 3.9. Spread 2.1. Trend −13.6%.
The five-metric read: Demand Index (magnitude), Engagement Readiness (composition), Demand Spread (diversification), Demand Over Time (momentum), and Buying Intent Index (efficiency). Each one is benchmark-calibrated across categories so they stay comparable. Together they answer: how big is this category, how close is it to action, how concentrated is the demand, where is it heading, and how decisive is the audience.
The metrics tell you the present state. The signals tell you what the present state is becoming. We surface emerging behaviours that haven’t yet shown up in survey-based research, white spaces where commercial demand exists but no brand is meeting it, and the structural shifts the metrics surface but don’t fully describe. Most of the strategic value of the report sits here.
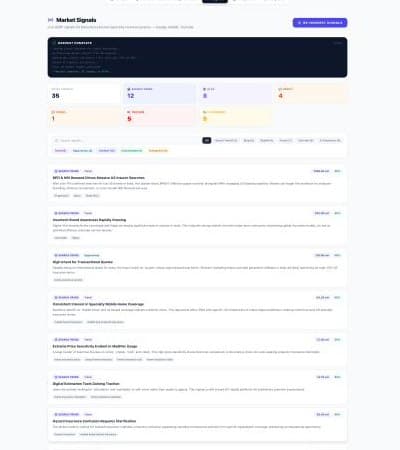
35 live signals. 12 emerging behaviours. 4 urgent.
For each priority category we go further: driver and barrier maps showing what pulls consumers in and what holds them back, segment architecture showing how the audience splits behaviourally, and brand performance showing who is winning, where, and why. This is where the report shifts from intelligence to specific recommendation — and where the senior-analyst layer adds the most weight.
Executive summary, drivers, barriers, brand landscape.
The bridge from intelligence to action. For each category we recommend, the playbook lays out the entry move, the messaging architecture, the price-point logic, the channel sequence, and the defensive posture against incumbents. Every recommendation is grounded back to a specific signal in the report — so when leadership asks "why this", the answer is in the data, not the deck.
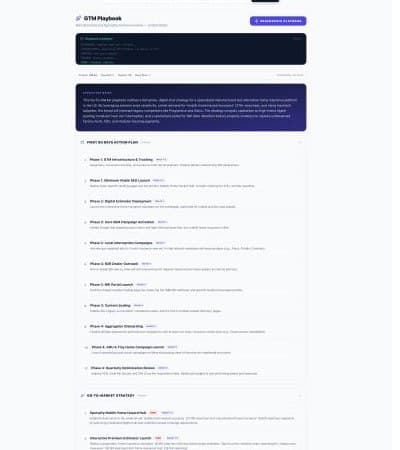
First 90 days. Channel plan. Pricing. Content. Risks.
Previews above are real platform output from a US specialty home insurance run — every report is custom-scoped to your category, market, and brief. No template, no off-the-shelf deliverable.
The chart at the end.
Every Urchin report ends here — your category set mapped on Buying Intent Index against Demand Over Time. One chart. Four quadrants. A clear picture of where to invest, where to defend, where to place strategic bets, and where to walk away.
Lead with these.
High scale, decisive audience, accelerating demand. Defend market share aggressively and price for premium positioning.
Hold the line.
Large category, lower decisiveness. The audience is in research mode — fix the funnel before competitors do.
Place small bets.
Small base, decisive audience. Niche but high-margin — ideal for premium sub-brands or specialist plays.
Walk away (mostly).
Structurally weak: small, fragmented, decelerating. Re-enter only if there is a specific structural reason to play.
A report is a conversation, not a PDF.
Every Urchin engagement comes with a senior-analyst walkthrough — a 60-minute working session where we present the findings, take your team’s questions, and pressure-test the implications against what you already know. The PDF is the artefact. The conversation is the value.
PDF or live link.
Presentation-ready or working document — your choice. Most clients want both.
Custom-scoped.
Every project is scoped to the brief. We do not sell standardised reports or templated decks.
Senior-reviewed.
Every output passes through a senior analyst layer before it leaves us. AI generates breadth. Humans make the calls.
Start a brief.
A finished question, a half-formed idea, or just a category you want to understand. We will take it from there.